States · Tennessee
Tennessee: every county, ranked.
The State Screen scores all 95 counties in Tennessee from 0 to 100 against each other on the four things a homestead can't do without: water, privacy, hazard exposure and access. Nothing is screened out.
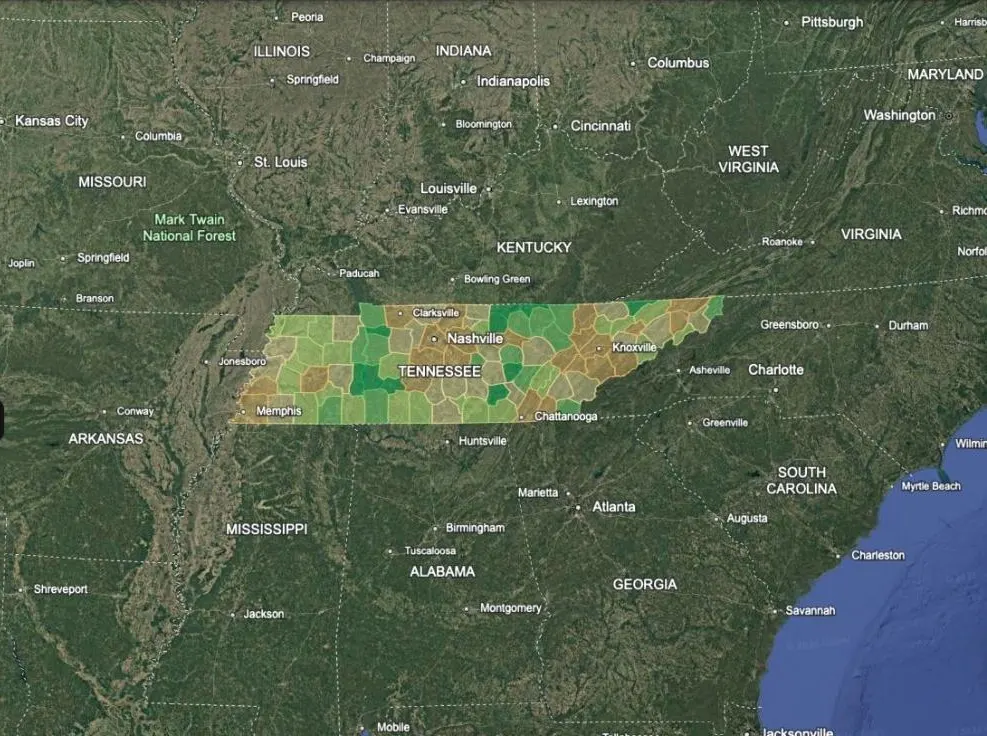
Top five counties
- Pickett County
- Van Buren County
- Clay County
- Hancock County
- Grundy County
In order, without their scores. Every county's score, its four sub-scores and the raw numbers behind them are in the free map.
Free for an email address: a Google Earth file with every county clickable.
What the map says about Tennessee
Rain is rarely the problem in Tennessee: the median county gets 56 inches a year, and the wettest 63.
Across the 47 counties with enough wells on record, the typical well is 154 ft deep. In 47% of those counties the median well is 150 ft or shallower; in 4% it is 400 ft or more.
The hazard that scores worst most often is landslide, in 42 of 95 counties.
7% of Tennessee's counties sit outside every metro commuting ring, and the median one is 5 miles from a town of 5,000.
These are counties, not parcels. A good score says the region has the water, the quiet and the hazard profile; it says nothing about a particular piece of land's flood zone, access or water source.
Then make it yours
The State Screen is one opinion of what matters. The complete map is 35 layers you switch on and off to suit your own search — wildfire, water rights, radon, well depth, state gun and homeschool law, distance from the cities, military sites and more — across the US, Canada and Mexico.